Screenshots of different TA trading signals
>> Simple Moving Average (SMA)
>> Weighted Moving Average (WMA)
>> Exponential Moving Average (EMA)
>> Moving Average Convergence Divergence (MACD)
>> Parabolic SAR
>> Stochastic (STC)
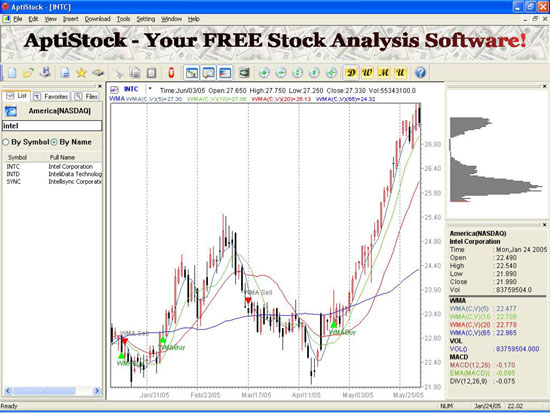
Weighted Moving Average (WMA)
The SMA is the most popular indicator used by technical analysts. But some experts question its usefulness because SMA only take into acount the period covered by the average (the last 20 days, for example). Another issue is SMA gives equal weight to each day's price. In a 20 days average, the last day receives the same weight as the first day in the calculation. They claims that more weighting should be given to the more recent price action.
In order to correct the weighting problem, some use Weighted Moving Average (WMA). In a 10 days WMA, the closing price of the 10th day woluld be multiplied by 10, the 9th day multiplied by 9 and so on. The greater weight is therefore given to the more recent closings. The total is then divided by the sum of the multiplier, 55 (10+9+8+...)
The Volume Weighted Moving Average (VWMA) is a moving average of prices where the price at any given point over the period is weighted by the volume that ocurred at that particular price. It is calculated by multiplied the price times the volume for a given day, summing these products over the period and dividing the result by the total volume over the period. The result is a moving average that is more responsive on days with higher volume. A text note showing the overlay and color of the overlay is added to the chart in the upper left corner. The most recent value of the VWMA is also shown
Trading signals
 Go Long : WMA(shorter period) cross above WMA(longer period) Go Long : WMA(shorter period) cross above WMA(longer period)
Go Short: WMA(shorter period) cross below WMA(longer period)
Above shows four VWMA lines with a period of 5,10,30 and 60 days for INTC (Nasdaq - Intel). These VWMA lines are frequently used indicators for the trend of a stock. Using these indicators for a trending stock such as this, the following trades might have made by assuming that trading made at the open price on the following day when VWMA generated a trading signal base on VWMA with a period of 5 days, VWMA(5) and VWMA with a period of 30 days, VWMA(30).Please note that the profit is calculated solely on the difference of the open position price and close position price excluded the commission and etc.
Date |
Signal |
Action |
Profit/share |
19-Jun-05 |
Long |
Long signal - VWMA(5) cross above VWMA(30) |
|
20-Jan-05 |
|
Go Long at $22.52. Set cut loss point at $20.30 |
|
20-Jun-05 |
Short |
Short signal - VWMA(5) cross below VWMA(30) |
|
|
|
Go Hold - Low price at $22.40, above cut loss |
|
21-Jun-05 |
|
Go Hold - Open price at $22.58, above cut loss |
|
07-Feb-04 |
Long |
Long signal - VWMA(5) cross above VWMA(30) |
|
08-Feb-05 |
|
Go Long at $22.95. Set cut loss point at $21.80 |
|
17-Mar-05 |
Short |
Short signal - VWMA(5) cross below VWMA(30) |
|
18-Mar-05 |
|
Close position - 1 at $23.61 |
$1.09 |
|
|
Close position - 2 at $23.61 |
$0.66 |
| |
|
Total |
$1.75 |
|