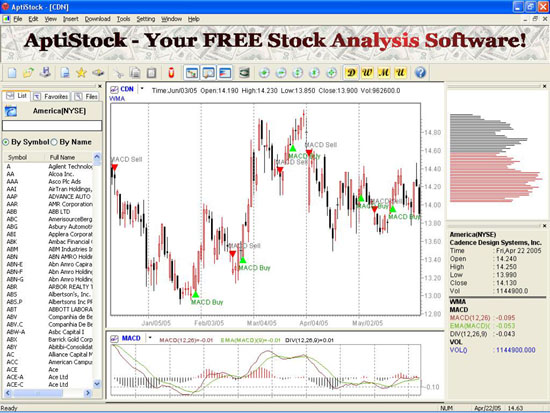
There are two lines in the MACD indicator. The faster line (MACD line) results from the difference between the 26 days EMA of the closing prices subtracted from the 12 days EMA of the closing prices. The slower line (signal line) is a moving average of the fast line. It is usually a 9 days EMA of the faster line.
Date |
Signal |
Action |
Profit/share |
16-Dec-04 |
Short |
Short signal - MACD cross below Signal line |
|
17-Dec-04 |
|
Go Short at $14.10. Set cut loss point at $15.51 |
|
01-Feb-05 |
Long |
Long signal - MACD cross above Signal line |
|
02-Feb-05 |
|
Close position at $13.15 |
$0.95 |
22-Feb-05 |
Short |
Short signal - MACD cross below Signal line |
|
23-Feb-05 |
|
Go Short at $13.28. Set cut loss point at $13.94 |
|
28-Feb-05 |
Long |
Long signal - MACD cross above Signal line |
|
01-Mar-05 |
|
Go Hold - Open price at $13.81 below cut loss |
|
02-Mar-05 |
Cut |
Cut loss at $13.94 |
$-0.66 |
| |
|
Go Long at $13.94. Set cut loss at $13.24 |
|
| 18-Mar-05 |
Short |
Short signal - MACD cross below Signal line |
|
| 21-Mar-05 |
|
Go Hold - Open price at $14.27 above cut loss |
|
| 28-Mar-05 |
Long |
Long signal - MACD cross above Signal line |
|
| 29-Mar-05 |
|
Close position at $14.82 |
$0.88 |
| 05-Apr-05 |
Short |
Short signal - MACD cross below Signal line |
|
| 06-Apr-05 |
|
Go Short at $14.45. Set cut loss point at $15.17 |
|
| 03-May-05 |
Long |
Long signal - MACD cross above Signal line |
|
| 04-May-05 |
|
Close position at $14.21 |
$0.24 |
| 10-May-05 |
Short |
Short signal - MACD cross below Signal line |
|
| 11-May-05 |
|
Go Short at $13.90. Set cut loss point at $14.60 |
|
| 19-May-05 |
Long |
Long signal - MACD cross above Signal line |
|
| 20-May-05 |
|
Close position at $14.10 to preserve money |
-$0.20 |
| |
|
Total |
$1.21 |