Screenshots of different TA trading signals
>> Simple Moving Average (SMA)
>> Weighted Moving Average (WMA)
>> Exponential Moving Average (EMA)
>> Moving Average Convergence Divergence (MACD)
>> Parabolic SAR
>> Stochastic (STC)
Exponential Moving Average (EMA)
The SMA's weighting issue can also be solve by using Exponential Moving Average (EMA) or also known as Exponential Weighted Moving Average. The EMA addresses the problems by weighting past history prices less and less, without ever removing the data completely. So it eliminates the impact when a data point is dropped from the moving average. It still appropriately gives the highest weighting to most recent data. It is an accumulative average, factoring in all the historical data.
The EMA calculation looks like this:
EMAn= Pn * K + EMAn-1 * (1-K) where K= 2/(period +1)
In English, it would read:
Today's EMA = (Today's Closing Price * K) + (Yesterday's EMA * (1-K))
Trading signals
 Go Long : EMA(shorter period) cross above EMA(longer period) Go Long : EMA(shorter period) cross above EMA(longer period)
Go Short: EMA(shorter period) cross below EMA(longer period)
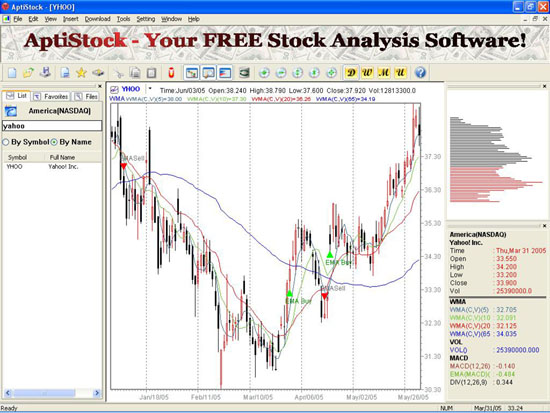
Above shows four EMA lines with a period of 5,10,30 and 60 days for INTC (Nasdaq - Intel). These EMA lines are frequently used indicators for the trend of a stock. Using these indicators for a trending stock such as this, the following trades might have made by assuming that trading made at the open price on the following day when EMA generated a trading signal base on EMA with a period of 5 days, EMA(5) and EMA with a period of 30 days, EMA(30).Please note that the profit is calculated solely on the difference of the open position price and close position price excluded the commission and etc.
Date |
Signal |
Action |
Profit/share |
06-Jan-05 |
Short |
Short signal - EMA(5) cross below EMA(30) |
|
07-Jan-05 |
|
Go Short at $36.32. Set cut loss point at $39.95 |
|
31-Mar-05 |
Long |
Long signal - EMA(5) cross above EMA(30) |
|
01-Apr-05 |
|
Close position at $34.18 |
$2.14 |
18-Apr-05 |
Short |
Short signal - EMA(5) cross below EMA(30) |
|
19-Apr-05 |
|
Go Short at $32.96. Set cut loss point at $34.60 |
|
20-Apr-05 |
Cut |
Cut loss at $34.96. Open price above cut loss |
-$2.00 |
20-Apr-05 |
Long |
Long signal - EMA(5) cross above EMA(30) |
|
21-Apr-05 |
|
Go Long at $35.12. Set cut loss point at $31.60 |
|
| |
|
Total |
$0.14 |
|