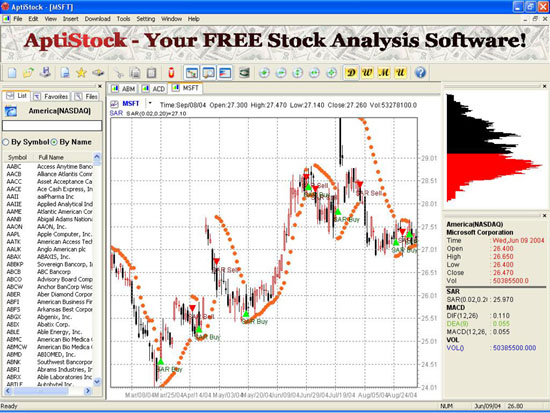
Parabolic SAR was developed by J. Welles Wilder Jr. and is described in his book New Concepts in Technical Trading Systems. SAR stands for stop and reverse. Parabolic SAR is an indicator that we can safely say is a very useful and accurate tool during a trending period - when it provides excellent entry and exit points.
A stop loss is calculated for each day using the previous days data. The advantage Parabolic SAR is that the stop level can be calculated in advance of the market opening. A stop level or dot below the current price indicates that the price is generally bullish. The stop level will move up every day. When price falls to the stop level, a SAR signal generated. Whereas a stop level above the current price indicates that the price is generally bearish and the position is short. The stop level moves down every day until the price rises to the stop level, a SAR signal triggered.
Date |
Signal |
Action |
Profit/share |
25-Mar-04 |
Long |
Long signal - Price switch above SAR stop level |
|
26-Mar-04 |
|
Go Long at $25.11. Set cut loss point at $22.60 |
|
15-Apr-04 |
Short |
Short signal - Price switch below SAR stop level |
|
16-Apr-04 |
|
Go Hold - Open price at $25.33 above cut loss |
|
20-Apr-04 |
Long |
Long signal - Price switch above SAR stop level |
|
21-Apr-04 |
|
Go Long at $25.36. Set cut loss point at $24.10 |
|
30-Apr-04 |
Short |
Short signal - Price switch below SAR stop level |
|
01-May-04 |
|
Go Hold - Open price at $26.19 above cut loss |
|
19-May-04 |
Long |
Long signal - Price switch above SAR stop level |
|
20-May-04 |
|
Go Long at $25.75. Set cut loss point at $24.98 |
|
29-Jun-04 |
Short |
Short signal - Price switch below SAR stop level |
|
30-Jun-04 |
|
Go Hold - Open price at $28.57 above cut loss |
|
30-Jun-04 |
Long |
Long signal - Price switch above SAR stop level |
|
01-Jul-04 |
|
Go Long at $28.70. Set cut loss point at $27.84 |
|
06-Jul-04 |
Short |
Short signal - Price switch below SAR stop level |
|
07-Jul-04 |
|
Close position-1 at $27.67 |
$2.56 |
| |
|
Close position-2 at $27.67 |
$2.31 |
| |
|
Close position-3 at $27.67 |
$1.92 |
| |
|
Close position-4 at $27.67 |
-$1.03 |
20-Jul-04 |
Long |
Long signal - Price switch above SAR stop level |
|
21-Jul-04 |
|
Go Long at $29.89. Set cut loss point at $29.00 |
|
21-Jul-04 |
Cut |
Cut loss at $29.00 |
-$0.89 |
03-Aug-04 |
Short |
Short signal - Price switch below SAR stop level |
|
04-Aug-04 |
|
Go Short at $28.01. Set cut loss point at $28.85 |
|
25-Aug-04 |
Long |
Long signal - Price switch above SAR stop level |
|
26-Aug-04 |
|
Go Hold - Open price at $27.46 below cut loss |
|
30-Aug-04 |
Short |
Short signal - Price switch below SAR stop level |
|
31-Aug-04 |
|
Go Short at $27.29. Set cut loss point at $28.10 |
|
02-Sep-04 |
Long |
Long signal - Price switch above SAR stop level |
|
03-Sep-04 |
|
Close position-5 at $27.46 to preserve money |
$0.55 |
| |
|
Close position-6 at $27.46 to preserve money |
-$0.17 |
| |
|
Total |
$5.25 |